
-
Why USCCG

Why USCCG
We deliver measurable financial results. We work inside real production environments, not conference rooms, building stronger management operating systems that drive sustained output, cost control & accountability We combine rapid diagnostic work with hands-on implementation to improve how your operation plans, executes & follows up every day.
 Join a team that works shoulder-to-shoulder with operators and executives to solve real operational challenges on the ground.We’re Ready to ListenGot a business problem and want to kick around some ideas to solve it?
-
What We Improve
What We Improve
We improve output, reliability, quality, cost, and execution discipline. Our work strengthens the Management Operating System — the daily routines and controls that drive results. Every engagement delivers measurable financial impact. Prepare teams, systems & leadership routines to execute major outages, restarts & transitions with control.
 Reduce downtime & stabilize performance by improving planning, preventive maintenance & follow-up discipline.
 Improve material flow, inventory visibility, and supplier performance to reduce delays and strengthen operational continuity.
-
Industries
Industries
We work with production-driven organizations that make, move or maintain physical products. In complex operations, throughput, uptime & cost control directly impact financial performance. While industries differ, disciplined execution & strong management systems are universal. Improve throughput, equipment reliability & cost control in high-variability, asset-intensive environments.
 Increase output, stabilize processes & improve supervisory follow-up across discrete & process manufacturing.
 Accelerate value creation by stabilizing operations, improving EBITDA drivers & building sustainable leadership systems.
 Strengthen line performance, quality control & production scheduling in fast-moving consumer operations.
-
Insights
Insights
Our insights reflect decades of on-the-ground operational work. We share practical perspectives on management operating systems, execution discipline, reliability, and productivity improvement. Every article is rooted in real-world application, not theory.Featured insightStrategies for Meeting Increasing Customer DemandIf you have noticed or, in many cases, been run over by dramatically increasing customer demand for your products, you’re not alone.


-
Why USCCG
Why USCCG
We deliver measurable financial results. We work inside real production environments, not conference rooms, building stronger management operating systems that drive sustained output, cost control & accountability
We combine rapid diagnostic work with hands-on implementation to improve how your operation plans, executes & follows up every day.
Join a team that works shoulder-to-shoulder with operators and executives to solve real operational challenges on the ground.We’re Ready to ListenGot a business problem and want to kick around some ideas to solve it? -
What We Improve
What We Improve
We improve output, reliability, quality, cost, and execution discipline. Our work strengthens the Management Operating System — the daily routines and controls that drive results. Every engagement delivers measurable financial impact.
Prepare teams, systems & leadership routines to execute major outages, restarts & transitions with control.
Reduce downtime & stabilize performance by improving planning, preventive maintenance & follow-up discipline.
Improve material flow, inventory visibility, and supplier performance to reduce delays and strengthen operational continuity. -
Industries
Industries
We work with production-driven organizations that make, move or maintain physical products. In complex operations, throughput, uptime & cost control directly impact financial performance. While industries differ, disciplined execution & strong management systems are universal.
Improve throughput, equipment reliability & cost control in high-variability, asset-intensive environments.
Increase output, stabilize processes & improve supervisory follow-up across discrete & process manufacturing.
Accelerate value creation by stabilizing operations, improving EBITDA drivers & building sustainable leadership systems.
Strengthen line performance, quality control & production scheduling in fast-moving consumer operations. -
Insights
Insights
Our insights reflect decades of on-the-ground operational work. We share practical perspectives on management operating systems, execution discipline, reliability, and productivity improvement. Every article is rooted in real-world application, not theory.Featured insightStrategies for Meeting Increasing Customer DemandIf you have noticed or, in many cases, been run over by dramatically increasing customer demand for your products, you’re not alone.
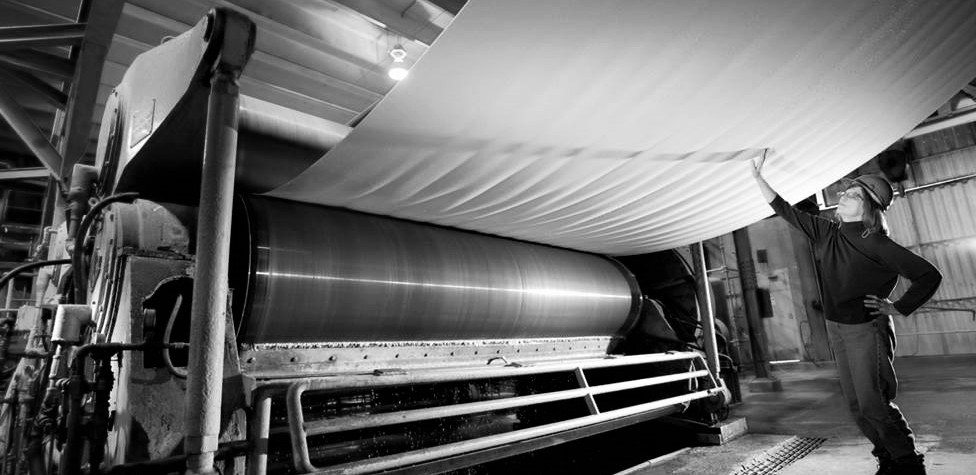
The Client
A leading provider of market pulp, paper, and pulp-based consumer products with mills in the U.S. and Canada, and sales and distributions operations across the globe.
The Challenge
While analyzing the cost structure of their fine paper operations, our client discovered that on a volume basis (lbs./ton), the cost of chemicals in its pulp bleaching operation had increased by more than $14,000,000 annually, despite no change in the demands of its customers. We were brought in to help them develop methods for optimizing chemical consumption.


Conclusion
After addressing the key causes of the cost increase and deploying the appropriate control tools in a four phase implementation roll-out, the variability in the mills’ bleaching operation was significantly reduced while maintaining the quality of the final product.
Additionally, the client now has a newly trained workforce, and a repeatable process that can be used at their other sites to gain additional savings.
USCCG At Work:
Featured Client Results
Pulp and Paper Maker Bleaches Cost From Their Operation