-
Subscribe to Blog:
SEARCH THE BLOG
CATEGORIES
- Aerospace
- Asset Maintenance
- Automotive
- Blog
- Building Products
- Case Studies
- Chemical Processing
- Consulting
- Food & Beverage
- Forestry Products
- Hospitals & Healthcare
- Knowledge Transfer
- Lean Manufacturing
- Life Sciences
- Logistics
- Manufacturing
- Material Utilization
- Metals
- Mining
- News
- Office Politics
- Oil & Gas
- Plastics
- Private Equity
- Process Improvement
- Project Management
- Spend Management
- Supply Chain
- Uncategorized
- Utilities
- Whitepapers
BLOG ARCHIVES
- July 2025 (1)
- June 2025 (4)
- May 2025 (1)
- April 2025 (1)
- March 2025 (1)
- February 2025 (4)
- January 2025 (4)
- December 2024 (4)
- November 2024 (2)
- October 2024 (6)
- September 2024 (5)
- August 2024 (5)
- July 2024 (6)
- June 2024 (3)
- May 2024 (3)
- April 2024 (4)
- March 2024 (3)
- February 2024 (4)
- January 2024 (5)
- December 2023 (2)
- November 2023 (1)
- October 2023 (6)
- September 2023 (3)
- August 2023 (4)
- July 2023 (2)
- June 2023 (3)
- May 2023 (7)
- April 2023 (3)
- March 2023 (3)
- February 2023 (5)
- January 2023 (6)
- December 2022 (2)
- November 2022 (5)
- October 2022 (5)
- September 2022 (5)
- August 2022 (6)
- July 2022 (3)
- June 2022 (4)
- May 2022 (5)
- April 2022 (3)
- March 2022 (5)
- February 2022 (4)
- January 2022 (7)
- December 2021 (3)
- November 2021 (5)
- October 2021 (3)
- September 2021 (2)
- August 2021 (6)
- July 2021 (2)
- June 2021 (10)
- May 2021 (4)
- April 2021 (5)
- March 2021 (5)
- February 2021 (3)
- January 2021 (4)
- December 2020 (3)
- November 2020 (3)
- October 2020 (3)
- September 2020 (3)
- August 2020 (4)
- July 2020 (3)
- June 2020 (5)
- May 2020 (3)
- April 2020 (3)
- March 2020 (4)
- February 2020 (4)
- January 2020 (4)
- December 2019 (3)
- November 2019 (2)
- October 2019 (4)
- September 2019 (2)
- August 2019 (4)
- July 2019 (3)
- June 2019 (4)
- May 2019 (2)
- April 2019 (4)
- March 2019 (4)
- February 2019 (5)
- January 2019 (5)
- December 2018 (2)
- November 2018 (2)
- October 2018 (5)
- September 2018 (4)
- August 2018 (3)
- July 2018 (2)
- June 2018 (4)
- May 2018 (3)
- April 2018 (3)
- March 2018 (2)
- February 2018 (2)
- January 2018 (1)
- December 2017 (1)
- November 2017 (2)
- October 2017 (2)
- September 2017 (1)
- August 2017 (2)
- July 2017 (2)
- June 2017 (1)
- April 2017 (3)
- March 2017 (3)
- February 2017 (2)
- January 2017 (2)
- December 2016 (2)
- November 2016 (4)
- October 2016 (4)
- September 2016 (3)
- August 2016 (6)
- July 2016 (4)
- June 2016 (4)
- May 2016 (1)
- April 2016 (3)
- March 2016 (4)
- February 2016 (2)
- January 2016 (4)
- December 2015 (3)
- November 2015 (3)
- October 2015 (1)
- September 2015 (1)
- August 2015 (4)
- July 2015 (6)
- June 2015 (4)
- May 2015 (7)
- April 2015 (6)
- March 2015 (6)
- February 2015 (4)
- January 2015 (3)
CONNECT WITH US
Tag Archives: Miners
Like any other industry, metal manufacturing can benefit greatly from a reduction in operational expenses. Smarter, data-driven processes have the potential to eliminate waste in smelting and deliver sustainability at ore extraction sites even during troubled times. What lies ahead for metal producers the world over, and how might operational excellence help them rise to the occasion as their industry matures?
“2017 looks to be an upward-trending year for steel and iron ore prices, but only barely.”
Pricing forecasts show slow improvement
After the commodities boom peaked in 2011 and plummeted thereafter, any small gains to entrenched businesses are welcome. According to Knoema, 2017 looks to be an upward-trending year overall for steel and iron ore prices, but only barely. The projections also show a plateau throughout the rest of the decade, a sign that market value will not soon return to the twofold or even threefold per-tonne prices the metal industry enjoyed at the start of the 21st century.
With this in mind, businesses should feel comfortable instituting opex-cutting initiatives like predictive analysis for asset performance or standardized operating procedures for changeovers. After all, operationally efficient strategies will allow the companies that adopt them to become more responsive to not only their needs, but the needs of their customers, as their interests and expectations shift because of pricing. Operational excellence, therefore, makes room in the budget to build a better, more attractive product with a lower risk of financial turbulence.
Labor costs increase as ore grades decrease
Much of the metal industry’s costs upstream of smelters revolve around labor – around 40 to 50 percent in the mining sector, for example, according to a 2016 study from Deloitte. Industry leaders know the implausibility of simply pushing mining staff to extract more ore at a faster clip. Even though the depletion of high-grade ore deposits across the globe has led to the development of equipment potentially capable of cost-efficient low-grade ore extraction, the exchange has not been commensurate. The loss of high-grade ore opportunities currently trumps any gains reclaimed through innovation.
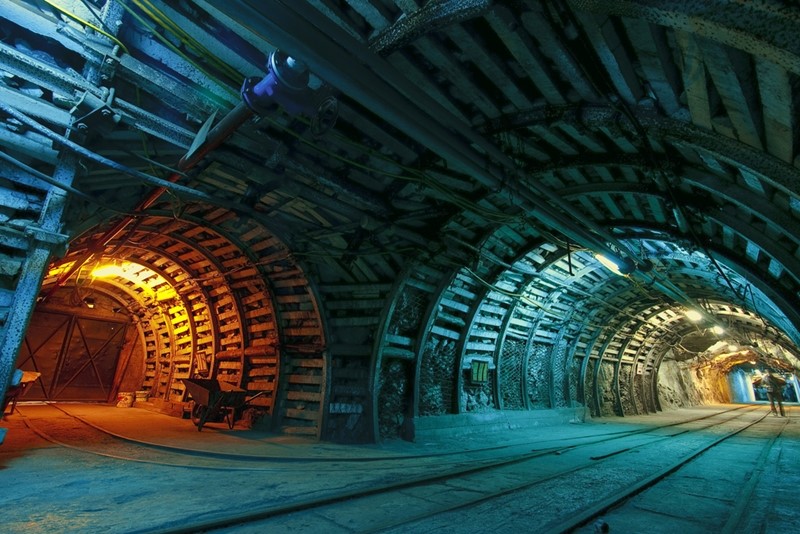
Operational excellence helps low-grade ore mining become more cost efficient.
With prices as low as they are in 2016 and mining companies squeezing what they can out of already overextended mines, something else has got to give. Metal producers need eyes on upstream operations and actionable intelligence to know how, where, and when to optimize effectively, particularly if they wish to avoid labor fallout from unobtainable operational demands from their workforces.
Economic improvement in other sectors pushes metal to produce under strain
As dim as the short-term outlook appears for many metal producers, long-term growth in areas like construction and automotive provide a silver lining. According to PricewaterhouseCoopers, construction output volumes around the world will increase 85 percent between now and 2030, with China, India, and the U.S. leading the charge. And while U.S. auto sales might stagnate over the next couple years, the incorporation of new gadgets into the average vehicle could prove to be a boon to rare metals used primarily in electronics. Moreover, project sales boosts in China signal even more innovation requiring a bounty of diverse materials.
As we mentioned earlier, operational excellence make businesses lighter on their feet and should not be seen exclusively as a method for tightening spend management. After all, the best defense is a good offense. So while metal producers incorporate new processes designed to navigate the disruptions affecting their sector, they shouldn’t lose sight of the opportunities for success on the horizon. To achieve them, however, these companies will need flexibility and agility, both of which they can gain through operational insight and optimization.
Can smarter asset management and maintenance strategies address mining issues of today, as well as those on the horizon?
When they supply manufacturing and other process industries with the minerals they need to service their customers, the U.S. mining industry also performs an incredible service to the stability of the nation. The mining industry processes hundreds of billions in minerals each year, and once delivered to other sectors, the materials added more than triple their worth to the economy, according to the National Mining Association. Mining is the fuel for the engine of production.
An industry so valuable to the economic integrity of the U.S. requires reliability-centered maintenance initiatives to protect and preserve mining assets over their entire life cycles. By investing in regular, data-driven repairs, mining assets have the potential to last longer, and their owners avoid cost increases related to inefficient operation, downtime and replacement, among others. But mining is an industry like no other, one with its own set of unique challenges.
Long hours of operation take their toll on mining assets
So long as there are minerals left to mine, a mining company’s extraction process will continue to be lucrative. But while mine workers and equipment operators in the U.S. average just over 44 hours weekly, according to the U.S. Bureau of Labor Statistics, the assets they utilize on the job may virtually never really stop running. According to literature published by the state of Illinois detailing a day in the life of a coal miner, many mines operate 24 hours per day. So, while workers might come and go according to their shift schedules, on-site assets function around the clock.
“Operation without end increases an asset’s susceptibility to inefficiency and breakdowns.”
These conditions present two problems for mining assets and the legacy maintenance strategies used to protect them: First, running machines constantly for long hours obviously puts an incredible amount of physical strain on the equipment in question. Operation without end increases an asset’s susceptibility to inefficiency and breakdowns. Furthermore, when assets run on a 24-hour operations schedule, any downtime – planned or unplanned – detracts from site efficiency.
That said, planned downtime as part of a reliability-centered maintenance strategy can take advantage of data communicated between machine and managers to reduce time to repair. If mining telemetry effectively predicts machine deficiencies capable of spiraling into full-blown failures, maintenance crews can plan downtime to address these smaller concerns rather than waiting for a big, expensive breakdown. The ability to schedule maintenance in advance delivers benefits all its own. If a mine has any off hours, even a handful a day, maintenance can devote that time to their work orders accordingly.
As mining demand rises, so does the significance of uptime
If the previous points didn’t stress the importance of asset reliability and continuous production, hikes in mining demand will. Industrial and technological trends have added pressure to the mining industry, compounding the need for maintenance programs designed specifically to enhance uptime.
By the NMA’s assessment, the average computer chip contains upwards of 60 different minerals and elements, all requiring mining operations. Moreover, the latest technological advancements may involve expanded mining operations to extract new metals – in 2011, Technology Review discussed how the U.S. is the largest consumer of cobalt while, at the time, mining none of mineral itself. That has since changed.
“As businesses move back stateside, procurement will need to follow suit.”
Additionally, reshoring may also increase mining demand in the U.S. According to the Reshoring Initiative’s 2014 data report, America went from losing 140,000 manufacturing jobs per year to overseas companies to gaining 10,000 per year in the last decade. As businesses move back stateside, procurement will need to follow suit, lest they undermine the cost efficacy of relocating to the U.S. by sourcing abroad.
Reliability-centered maintenance for mining assets keeps equipment availability high and mines in operation. As heightened demand pushes productivity to the limit, every machine extracting or transporting minerals will require support from a maintenance plan working alongside asset management best practices to secure availability.
The prosperity of future mining operations depends on the industry’s ability to respond to forecasted demand, so why not use the same principle to enhance asset functionality? With reliability-centered maintenance, mine workers and machine operators turn asset data into actions, thereby reducing maintenance costs, eliminating large-scale failure events, improving safety and throwing their full weight behind value-added operations.
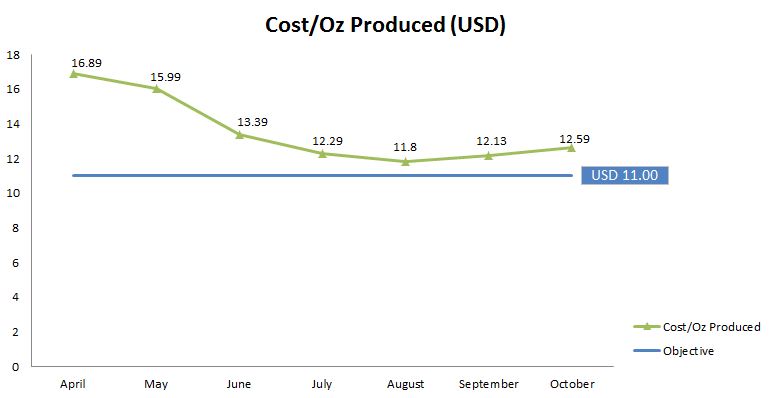
Recently, our mining team was asked to conduct a study at a silver mine in South America. The goal of this study was to uncover inefficiencies and implement a continuous improvement program within the mining operation and ultimately reduce operating cost per ounce. This was in response to the rapidly dropping price of silver. Therefore, time was of the essence. The recent volatility of this commodity had the management team at the mining company looking for ways to drastically reduce cost in their operation. Our response was to send a team of eight consultants to Argentina for a twenty-day site visit to conduct an analysis of the opportunities.
Discovering what an organization is currently using to manage its business is one of the most interesting parts of a study. You can quickly tell what is working for them and what isn’t. Usually, we are able to find some elements of a Management Operating System (MOS). Sometimes, more often than not, we discover that a functioning/closed-loop MOS is not in place or being used. This is also an early indication that the management team does not have full control of their operation. They may be measuring performance as a lagging indicator, but are unable to provide any leading indicators to performance trends. Without a closed-loop MOS it also becomes very difficult to make continuous improvement changes to impact performance and to actually measure the impact of those changes. Reporting alone will not allow management to do this. This is the first element we focused on at the silver mine.
Based on the initial assessment, our team and the client developed a realistic target for a reduced cost per ounce. In order to obtain the new reduced cost per ounce target, fifty Continuous Improvement Programs were developed. Continuous Improvement Programs vary in size, but all drive towards the same end goal of efficiency. In this case, the Continuous Improvement Programs developed were all intended to impact the utilization of a given level of resources. It is important to understand how much your resources are capable of without road blocks because this will be your “technical limit”. Although a technical limit is often unattainable, this is what the organization and management should be aiming for. Continuous Improvement Programs work to remove all of the road blocks possible in an effort to bring the operation as close to their technical limit as possible.
We were onsite to assist in the planning and implementation of each item from start to finish. With such a large number of Continuous Improvement Programs, it was very important to measure the progress towards completing each one and the associated impact they would have on the cost per ounce as they were completed. The financial impact of the changes was measured on a monthly basis.
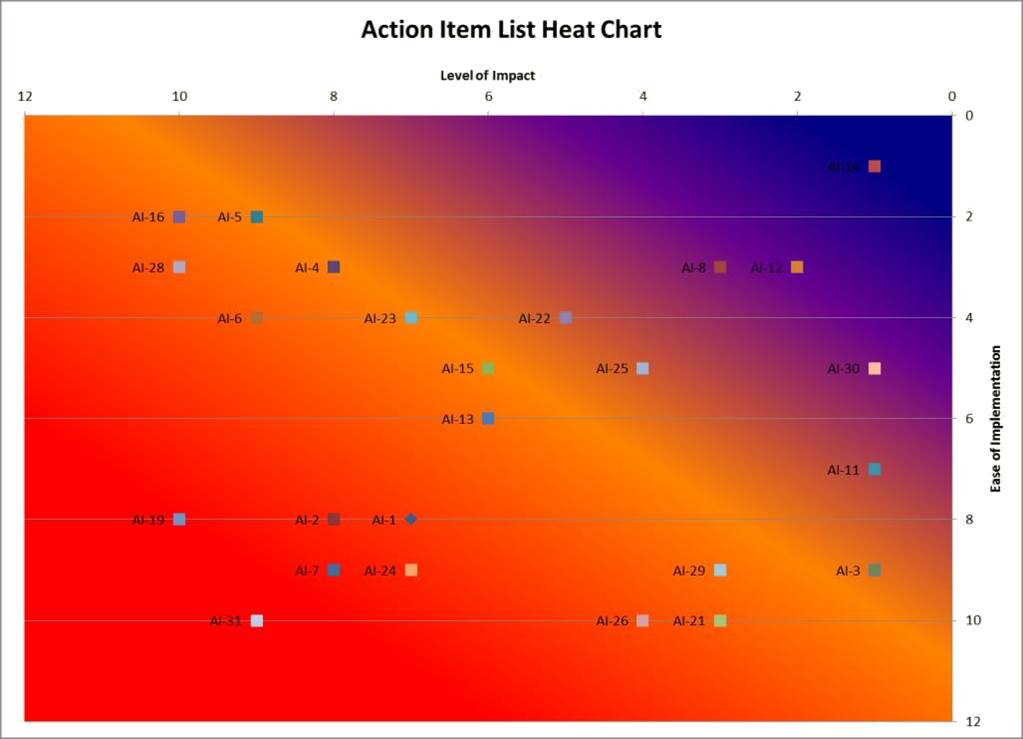
An important tool to use in conjunction with a Pareto chart is a heat map. Plotting action items on a heat map will allow you to prioritize each item based on two or more distinguishing variables. I typically use “ease of implementation” and “level of impact”. If you rank each item on a numerical scale and graph the results, it will provide a strong visual as to which items should take priority over others. From a results standpoint, you would ideally complete the items that will have a high impact and are easy to implement. This will provide the greatest yield with the least investment (time or otherwise).
There are several reasons why using this method can be a very effective way of managing action items. Firstly, process owners or champions typically have the most energy at the front end of the process. They are eager to make an impact and want to be a part of the leading charge. Secondly, it is very likely that as time goes on, new issues will arise and thus, more action items added to the list. There may be some new items that should take priority over older ones because of their importance. By maintaining an up-to-date heat map, each item can be analyzed for its individual importance.
What we have often found with a great deal of our clients is that when we arrive, they are not exactly sure what their organization is capable of. As we begin to show bursts of improvement throughout the project and provide tangible results, they begin to see how attainable continuous improvement really is. In addition to the fact that these results are attainable, they also realize that they are the ones taking ownership of it and to various extents, beginning to walk down the path themselves. The management operating system is theirs and could not function without them. At this stage, the behavioral change process has taken effect and this is what will drive your lasting results. This is the part that will bring your organization savings year over year.
With commodity pricing continuing to fluctuate worldwide, mining companies and other heavy-asset industries can benefit from better alignment of their revenue producing equipment with market demand. This does not require a significant capital investment. Inexpensive and sustainable approaches are available. Read out latest whitepaper from Charlie Payne, Senior Operations Manager in our Global Mining & Metals Practice to learn more.
The movement of broken rock or “muck” is critical in an underground mining operation. A large portion of mine design is based around getting the muck from the blast area to the surface. This intricate design involves many different methods including LHD (Load Haul Dump) machines, haul trucks, shaft skips, railcars, conveyors, and gravity fed muck passes. In many cases, all of the mentioned methods may be used in conjunction to form the muck system of an underground mine.
The objective of this muck system is to bring an inherently heavy substance (solid rock/ore), upwards in most cases, with as little effort as possible. Regardless of the methods your underground mine is utilizing to bring the muck to the surface, there are typically a limited number of routes to the surface because of the capital expenditure involved in creating exit points. As a result of this, there is a large impact to operations if one of these routes becomes blocked. A blockage may occur for several reasons: critical equipment failure, path blockage by other equipment, or pure congestion in the area. When this situation occurs, depending on where it occurs in the muck system, the muck will eventually back up to the source or where the mining activity is happening. A critical delay known as being “muck bound” occurs when blasting activities must cease to take place because there is nowhere to put the muck. The miners may be allocated to another location; however, that specific location will remain idle until the blockage is corrected. If this situation occurs in a high-grade area of the mine, it can be very costly to operations. With most other methods of moving muck relying only on proper maintenance and operation, the mobile LHD and haul truck operations provide a variable link between the active mining area and the muck system (below).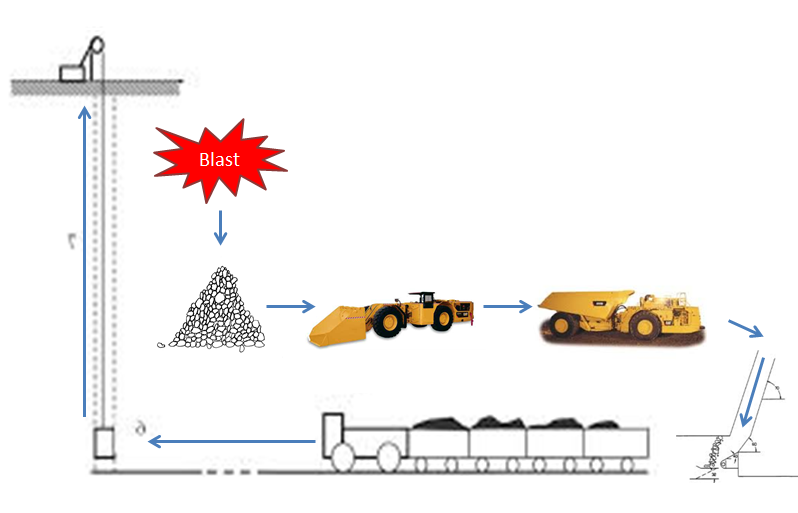
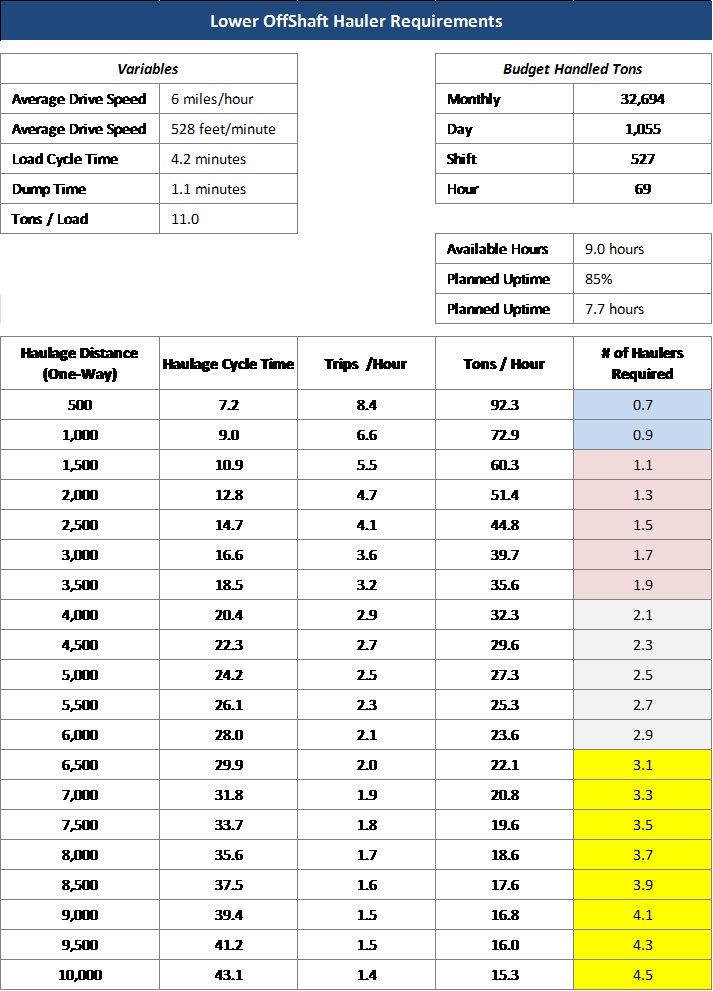
This link in the process can provide a source of opportunity or, if not managed properly, a major source of delay. It is a given that each active mining area will eventually require the assistance of this mobile team to come and take some of their broken rock away and thus, leaving them room to break more. As the breaking (blasting) of rock is arguably the most value added activity in a mine, it is in operations’ best interest to service the mining crew to the highest quality. This is accomplished by providing the miners with as much material as required, when needed, and removing all roadblocks so that the mining cycle can function at an optimal level. Given this great demand on the muck system to keep up with mining activities without allowing a backup of rock anywhere in the process, how does a mine with limited resources deploy these in the most effective manner day in and day out? The challenge of deploying a fixed level of resources effectively with the precision and flexibility to respond quickly to changes in the landscape is amplified greatly in larger mines. Due to the fact that larger operations typically share numerous resources across a vast number of working areas, changing a plan mid-shift can have a significant impact on other areas of the operation. Developing a distance chart could be one of the most valuable tools for your supervisors to use in conjunction with their own level of experience. Here is an example of a distance chart:
For each active mucking area, it outlines the optimal number of trucks that should be deployed to meet the demand of the mining crew. An important element to understand is the concept of optimal in this equation. The first requirement is that we meet the demand of the mining crew. The second requirement is that we meet this demand at the lowest possible cost because these resources could be required elsewhere. Your formula must take into account the following information: Forecasted Demand – How much rock is the mining crew planning to break? Congestion Factor in the Area – How much traffic, aside from mucking activity, is typically present at the location? Distance – What is the one-way distance from the loading location or mining area to the drop point feeding the muck system? Average Truck Cycle Time – Once a truck is loaded, how long will it take to drive to its dump point, dump the rock, and return? Average Truck Load Time – How long does it take for your LHD loader to fill one haul truck? Current Inventory – How much rock has the mining crew broken since last being “mucked” out? With all of these variables known, a distance chart can be created. When planning daily assignments, a distance chart can be very useful to determine the optimal ratio of trucks to LHD machines. This will allow for any excess resources to be allocated to other crews that are short, other areas of the mine, or other job functions. The use of this tool will not tell your crews where to go, but how many resources will be needed once there.
Obtaining the actual Inventory level can be one of the more challenging pieces of information to obtain. This information must be as real-time as possible and accurate. The actual inventory levels along with site priorities will be the guiding force on what locations will require “mucking” assistance. Distance charting, if used properly, can allow the muck system in a mine to rapidly allocate the right amount of resources to the areas that will yield the most benefit. In an industry where the misallocation of such expensive resources can be so costly, the opportunities to gain are equally as considerable. Distance charting is one of the many useful tools that will encourage opportunity seeking decision-making within your company from the front line supervisor level.
Maximize Your Return on Labor by Focusing on Advance/Man Shift
As one of the most valuable assets in an underground mine, the miners themselves can sometimes be overlooked when analyzing productivity and efficiency. Labor requirements are not always adjusted to suit the labor demands of different mining methods or conditions. The outcome is often over-crewing, resulting in excess labor costs associated with cost/ounce.
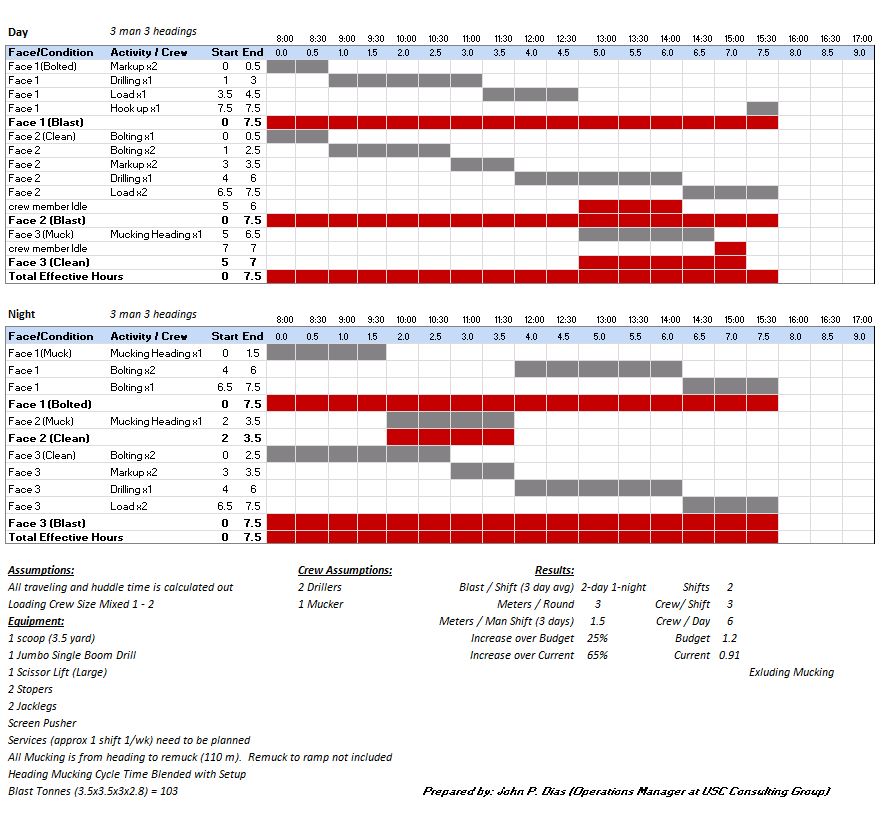
While the industry continues to move away from labor intensive mining methods, many jobs that can only be executed through the use of human capital still remain. This is where you may find large gaps between an experienced, highly skilled workforce and a younger, less skilled workforce. When building a crew for a development drive, it is crucial to set realistic expectations based on first hand observations of work-to-time relationships and provide a succinct message that these expectations are simply that. It is also important to clearly outline this message from a safety and employee morale perspective. Between direct observations and a consensus among the workforce, the following model was successfully prototyped at a North American gold mine, increasing productivity (as measured in meters/man shift) by up to 65%.
Firstly, it is imperative to understand how many people are required for each task and what tasks (if any) can be performed at the same time on one single heading. This will provide the basis for your model. In many cases, only one activity can be performed at the same time in the same heading by only one person. The removal of muck would be a good example of this, as only one miner would be needed in this heading for the duration of the task (mucking). Including any additional labor in this heading will not increase productivity or output in any way.
That being said, in the below example there are multiple activities that require the use of two miners, and therefore a crew size of at least two is expected. So how do you effectively allocate your one or two additional miners when a single person activity is being performed on the heading? The key word in that question is effectively. A common response to that question is to have the additional labor observe, clean up, refuel, prep, or assist if possible. In reality, with proper planning, none of those tasks would need to be done and are not an effective method of allocating your valuable underground resource.
The following model will show how effective providing multiple (three) work headings can be with a three person crew. The challenge then, from a planning and engineering perspective, is that they must provide the required number of headings as close in proximity as possible to each other. This ability is assumed in the following model.
With two shifts in each day and approximately eight operating hours available after line-outs and travel, the goal is to alternate between blasting two rounds on one shift and blasting one round on the other. Maintaining this cadence will yield three rounds per day (24 hours). If you are using a Productivity KPI such as meters (advance)/man shift, you will be targeting 1.5 meters/man shift (6 man shifts, 9 meters advanced). In other words, for every development miner you are sending underground, you can expect to advance your standard development headings by 1.5 meters.
In the case of our North American client, this target was achieved several times bringing them up from their current standing of .91 meters/man shift. This translates to a 64% improvement in labor productivity.

